


Fear and Greed Index values at 27.07.2026.
The Crypto Fear & Greed Index is a tool that allows you to assess the current psychological state of investors in the market. It is a version of the classic Fear & Greed Index adapted for the crypto market, originally developed by CNN Business to analyze sentiment in the stock market.
The index is divided into five categories: “extreme fear,” “fear,” “greed,” “neutral,” and “extreme greed.” Each corresponds to a specific range of values on a scale from 0 to 100. For example, a value between 0 and 24 indicates “extreme fear,” while a value above 76 indicates extreme greed.
How to interpret the Fear and Greed Index for Bitcoin and other cryptocurrencies
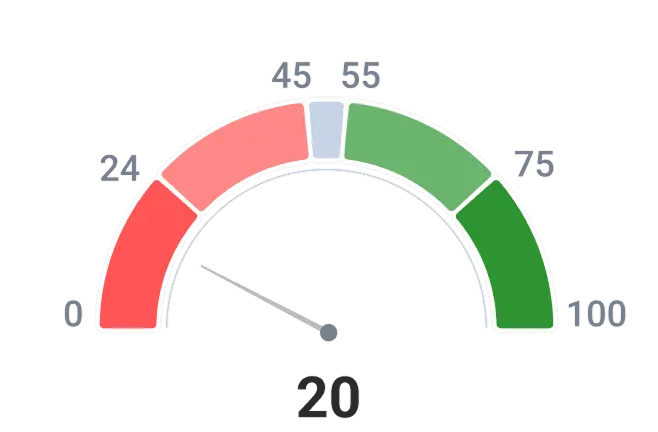
investors are selling assets en masse, and prices are falling below their real value
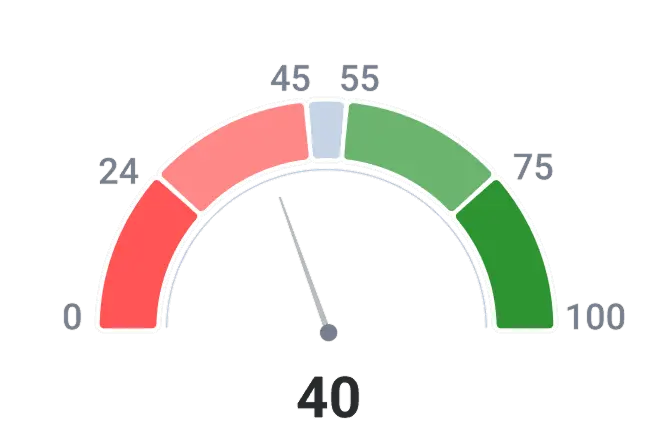
participants are in no hurry to buy, are waiting for signals, and fear further declines
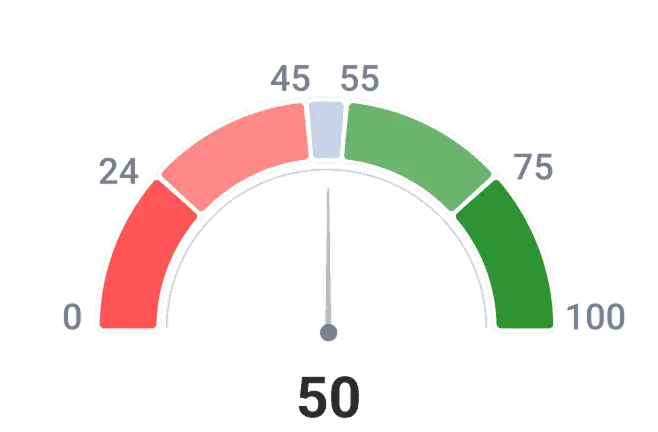
the market is calm, and prices are fluctuating without a clear trend
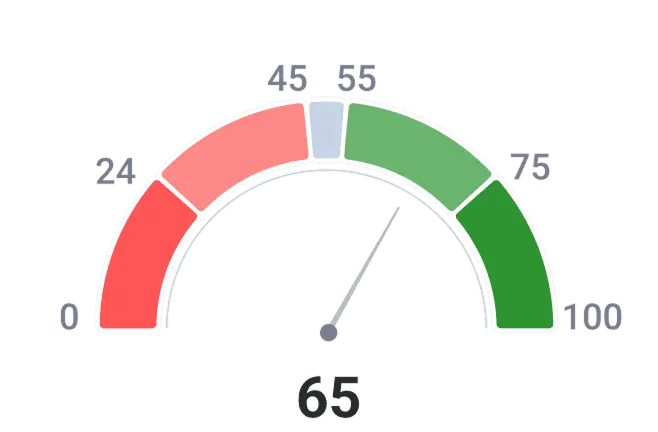
investors are actively buying, and the FOMO effect (“fear of missing out”) is increasing
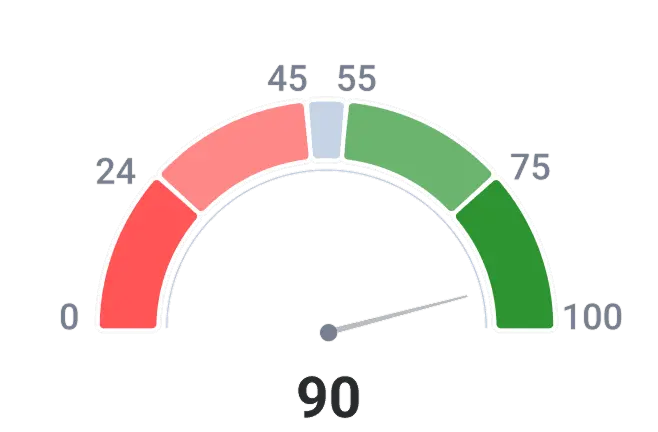
most are confident in endless growth, prices are inflated, and the risk of a correction is at its peak
How to use the index in practice
The Fear and Greed Index can be a useful tool for making investment decisions. However, you shouldn’t rely solely on it – it’s better to consider it in conjunction with technical and fundamental analysis tools. Below is a possible interpretation of the index values:
- Extreme Fear (0–24). You can buy assets at the most favorable prices. It is recommended to proceed cautiously – buy in increments and monitor the market. The market may remain in this state for weeks or even months;
- Fear (25–44). A potential buying opportunity. Prices may become even more attractive. It is recommended to gradually increase positions in promising projects;
- Neutral (45–55). It is recommended not to rush into purchases, to hold positions, and to monitor the market;
- Greed (56–75). A risky time to buy, as many assets are already overbought. You can begin gradually locking in profits (selling a portion of your assets);
- Extreme greed (76–100). Do not give in to euphoria and lock in a portion of your profits. The market may remain in this zone for a long time, but sooner or later a correction will occur.
Index calculation methodology
The Fear and Greed Index is calculated based on a set of indicators that, to varying degrees, reflect investor sentiment:
- Volatility (25%). This indicator allows you to track changes in an asset’s price and assess the magnitude of maximum drawdowns over a short period. Current values are compared to the average over the last 30–90 days. An increase in volatility above the average indicates growing fears and may signal impulsive investor behavior. Conversely, a drop in volatility below average suggests a shift in investor sentiment toward excessive confidence (greed): they hold onto assets and do not sell them, hoping to maximize profits and sell at a higher price;
- Market momentum and volume (25%). Here, traders assess changes in current Bitcoin trading volumes and the overall market direction. As with volatility indicators, the comparison is made against average values over the past 30–90 days. High trading volumes in a rising market indicate greed among participants, while in a falling market, they indicate fear. If volumes are below average, this indicates a neutral or uncertain investor sentiment;
- Social Media and current events (15%). Investors actively share their views on the market situation on social network X (formerly Twitter), which allows for tracking the overall sentiment of participants. The index collects information on the number of mentions, key hashtags related to cryptocurrencies, as well as likes and reposts. For example, the hashtag “To the Moon” means that investors are expecting potential price growth and are actively increasing their positions. Low activity may indicate indifference or uncertainty;
- Polls (15%). This section takes into account market participants’ opinions through voting on platforms and in popular communities. Investors share their predictions about what might happen to the cryptocurrency market in the near future and express their expectations;
- Dominance (10%). Bitcoin dominance refers to its market share relative to other cryptocurrencies. Typically, an increase in this metric indicates that investors are moving away from altcoins and into Bitcoin, as they view it as a more stable asset. A decline in dominance, on the other hand, may indicate growing interest in riskier but potentially profitable altcoins;
- Trends (10%). Google Trends tracks changes in the frequency of searches for terms like “Bitcoin,” “Bitcoin price,” “buy Bitcoin,” “sell Bitcoin,” etc. An increase in the number of positive search queries (such as “buy Bitcoin”) indicates investor greed and interest, while when investors search for terms like “Bitcoin crash,” this indicates fear.
All information is collected automatically: components are assigned fixed weights, after which the weighted scores are summed to produce the Fear & Greed Index. Data from various platforms is aggregated via API keys and processed using a special formula, resulting in a value ranging from 1 to 100.